
Adjusting Volatility Is One Of The Best Day Trading Tips You Will Get Many traders ask me for good day trading and swing trading tips. I recently discussed the concept of positive expectancy and how you should always maximize your profits and minimize your risk. I discussed a very important indicator that will help you achieve this goal. Today I’m going to teach you how to use the Average True Range (ATR) Indicator to measure stop loss placement levels as well as profit targets. I discussed the ATR previously in past articles, but I want to show you a real demonstration so that you can feel more comfortable incorporating this indicator into your trading plan. What Is The ATR The ATR was developed by J. Welles Wilder to measure the volatility of price changes, initially for the commodities and later adapted to the stock market as volatility in stocks rose substantially in the last 40 years. The ATR is not an entry or exit indicator so it’s not as popular as some other indicators such as the moving average or the Stochastic Indicator. However, the ATR is one powerful indicator and if used correctly can increase your profits and help you minimize risk at the same time. The ATR was originally designed for daily charts but since volatility has picked up so much over the last several decades, the indicator can be used just as effectively for intraday analysis.
How to use the MACD indicator
New PDF training guide explains the pillars of successful technical trading. Like how to understand common chart patterns, candlestick signals, stochastics and more.
Download it Now
The ATR Formula Contrary to several technical indicators, the ATR is extremely easy to calculate and just as simple to use. The ATR simply calculates the maximum values of the following three differences, and calculates the moving average of the resulting data series:
- Between the previous day’s high and low prices.
- Between the previous day’s close price and the current day’s high price.
- Between the previous day’s close price and the current day’s low price.
When used for day trading the formula simply changes the time frame from daily to intraday and the formula will take care of the rest. The ATR is built into most technical analysis software platforms so you don’t have to manually calculate anything yourself. The only change I make is I average the last 10 days or trading bars while the original formula averaged the ATR for 14 days or bars. I find that the shorter time frame makes the ATR react quicker to dynamic changes in volatility that occurs in today’s markets.
Learn To Measure Volatility
Let me show you a few examples of how the ATR measure volatility so that you can see how I use this indicator in real time. In this example you can see the E-mini SP Futures Contract. I specifically wanted to use this example because you can see how the Index starts off with relatively low volatility and consistent trading range and in the latter part of the example you can see how the volatility picks up and the ATR increases simultaneously with the increase of volatility.

Notice How ATR Increases as Volatility Increases If you were trading the E-mini SP Futures contract and you used a tight stop loss in January of this year you would probably do well but if you used the same type of stop loss in April of this year you would be stopped out before giving your trade the opportunity to work in your direction. Similarly, notice this chart of GLD which is an ETF designed to track the Gold market. This 15-minute chart demonstrates how the average trading range jumps from $0.20 cents to over $0.50 cents in one trading day. Many traders use the trading range to determine their stop loss placement, imagine if your stop loss level was based on $0.20 cent range when the market is trading at a $0.50 cent range.

Your Stop Loss Level and Profit Target Can Be Adjusted Based on the ATR Level What’s great about the ATR is that the numbers that are produced are based on actual dollar values of the market you’re trading. Imagine you are trading using an indicator like the RSI that gives you an overbought or oversold level. The ATR actually uses dollar values so you can easily make modifications to your stop loss and profit target levels based on the actual dollar changes you are seeing. In this example you can see how I adjust my stop loss level based on the volatility and more importantly the ATR average reading that I’m monitoring in real time. Notice how the stop loss moves dynamically as volatility increases. Thank God for electronic trading, imagine having to call the broker each time I make changes.

My Stop Loss Increases Each Time Volatility Increases
Stop Loss and Profit Target Placement
Now that you understand how the ATR is calculated and dynamically changes based on the actual volatility it’s time to see how to place actual orders. What I typically do is multiply the current ATR level by 2 and subtract that from my entry price if I’m going long. If I’m going short I multiply the current ATR * 2 and I add it to my entry price. Once there is a 20 percent increase or decrease in volatility I go through the process all over again. I keep doing this as often as I have to. Profit targets are calculated similarly, I take the current ATR and I multiply it by *4 and add that to my entry price. If I’m going short, I will subtract 4*ATR from my entry price.
Things To Keep In Mind
The ATR is the best way to measure volatility of your current position. It can be used with daily or intraday charts effectively. The only change you need to make is to adjust it to use 10 bars instead of 14 to make it a bit more dynamic. The ATR is very dynamic so don’t be afraid to make adjustments to your order as often as necessary. Don’t forget to subtract the ATR from your entry when you’re going long for stops and to add it to the entry when you’re using it for profit targets. Reverse this for short positions and you should do just fine. I hope these day trading tips will help you stay out of trouble in today’s volatile markets.
Bonus Article: What it means to “Bet the Jockey”

If you only looked at the markets after the close yesterday it would seem like a pretty uneventful day:
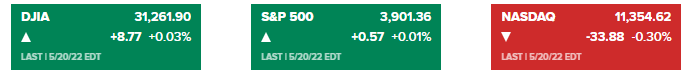
What the numbers above do not show is that at one point the Dow was down 700+ points and the markets officially entered a bear market. That whole “entered a bear market thing is really just a technical phrase because anyone who has owned just about any asset outside of energy and a few select NFT projects has been feeling the “bear” market all year. But rather than sit at home and listen to talking heads about why the world is about to end, let’s dive in…