DISCLAIMERS – THIS IS A PAID ADVERTISEMENT.
investingtarget.com
This is a paid advertisement, not a recommendation nor an offer to buy or sell securities. Our business model is to be financially compensated to market and promote public and private companies. By reading this email, our website / media webpage you agree to the terms of our disclaimer, which are subject to change at any time. We are not registered or licensed in any jurisdiction whatsoever to provide investing advice or anything of an advisory or consultancy nature and are therefore unqualified to give investment recommendations. Always do your own research and consult with a licensed investment professional before investing.
This communication is never to be used as the basis for making investment decisions and is for entertainment purposes only. At most, this communication should serve only as a starting point to do your own research and consult with a licensed professional regarding the companies profiled and discussed. Conduct your own research. Companies with low price per share are speculative and carry a high degree of risk, so only invest what you can afford to lose. By using our service you agree not to hold our site, its editor’s, owners, or staff liable for any damages, financial or otherwise, that may occur due to any action you may take based on the information contained within our website / media webpage.
For a full disclaimer & disclosure please click here.
This communication is a paid advertisement and is not a recommendation to buy or sell securities. IR PUB Network, and its owners, managers, employees, and assigns (collectively “the Company”) has been paid by the profiled companies or a third party to disseminate this communication. IThis compensation is a major conflict with our ability to be unbiased, more specifically: This communication is for entertainment purposes only. Never invest purely based on our communication.
Gains mentioned in this article, in our newsletter and on our website may be based on end-of-day or intraday data. Therefore, this communication should be viewed as a commercial advertisement only. The information is collected from public sources, such as the profiled company’s website and press releases, but is not researched or verified in any way whatsoever to ensure the publicly available information is correct. Furthermore, IR PUB Network often employs independent contractor writers who may make errors when researching information and preparing these communications regarding profiled companies. Independent writers’ works are double-checked and verified before publication, and approved by the company that is featured herein, but it is certainly possible for errors or omissions to take place during editing of independent contractor writer’s communications regarding the profiled company(s).
You should assume all information in all of our communications is incorrect until you personally verify the information, and again are encouraged to never invest based on the information contained in our written communications. The information in our disclaimers is subject to change at any time without notice. We have not thoroughly investigated the background of any of the companies we profile. The third party, profiled company, or their affiliates may liquidate shares of the profiled company at or near the time you receive this communication, which has the potential to hurt share prices. Frequently companies profiled in our alerts experience a large increase in volume and share price during the course of investor awareness marketing, which often end as soon as the investor awareness marketing ceases. We do not guarantee the timeliness, accuracy, or completeness of the information on our site or in our newsletters. The information in our communications and on our website is believed to be accurate and correct, but has not been independently verified and is not guaranteed to be correct. The information is collected from public sources, such as the profiled company’s website and press releases, but is not researched or verified in any way whatsoever to ensure the publicly available information is correct.
NOT AN INVESTMENT ADVISOR. The Company is not registered or licensed by any governing body in any jurisdiction to give investing advice or provide investment recommendation.
ALWAYS DO YOUR OWN RESEARCH and consult with a licensed investment professional before making an investment. This communication should not be used as a basis for making any investment.
INDEMNIFICATION/RELEASE OF LIABILITY. By reading this communication, you agree to the terms of this disclaimer, including, but not limited to: releasing the Company, its affiliates, assigns and successors from any and all liability, damages, and injury from the information contained in this communication. You further warrant that you are solely responsible for any financial outcome that may come from your investment decisions.
RISK OF INVESTING. Investing is inherently risky. While a potential for rewards exists, by investing, you are putting yourself at risk. You must be aware of the risks and be willing to accept them in order to invest in any type of security. Don’t trade with money you can’t afford to lose. This is neither a solicitation nor an offer to Buy/Sell securities. No representation is being made that any account will or is likely to achieve profits or losses similar to those discussed on this web site. We do not advise any reader to take any specific action. Losses can be larger than expected if the company experiences any problems with liquidity or wide spreads. Our website / media webpage are for entertainment purposes only. Never invest purely based on our featured profiles on Companies. Gains mentioned in our website / media webpage(s) may be based on end-of-day or intraday data. This publication and their owners and affiliates may hold positions in the securities mentioned in our alerts, which we may sell at any time without notice to our subscribers, which may have a negative impact on share prices. The past performance of any trading system or methodology is not necessarily indicative of future results. All trades, patterns, charts, systems, etc., discussed in this message and the product materials are for illustrative purposes only and not to be construed as specific advisory recommendations. All ideas and material presented are entirely those of the author and do not necessarily reflect those of the publisher.
investingtarget.com is copyright (© 2024) of IRP Holdings Corporation. All Rights Reserved. ]IRP Holdings Corporation
United States Post Office. P.O. Box 184 500 Venetia Rd. Pennsylvania 15367-9998
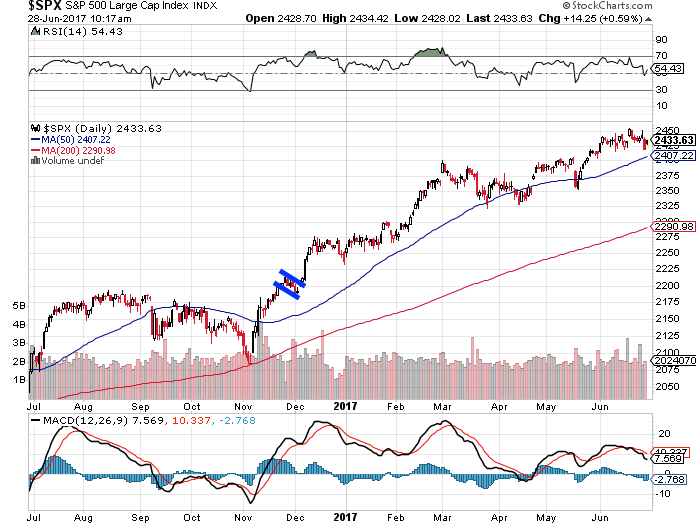
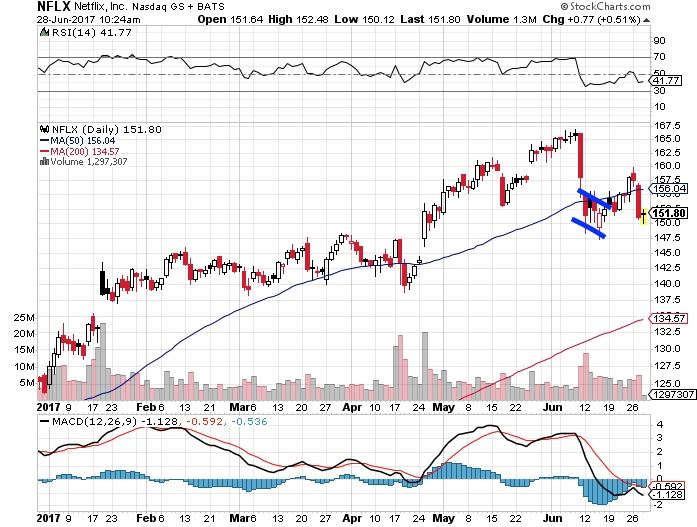
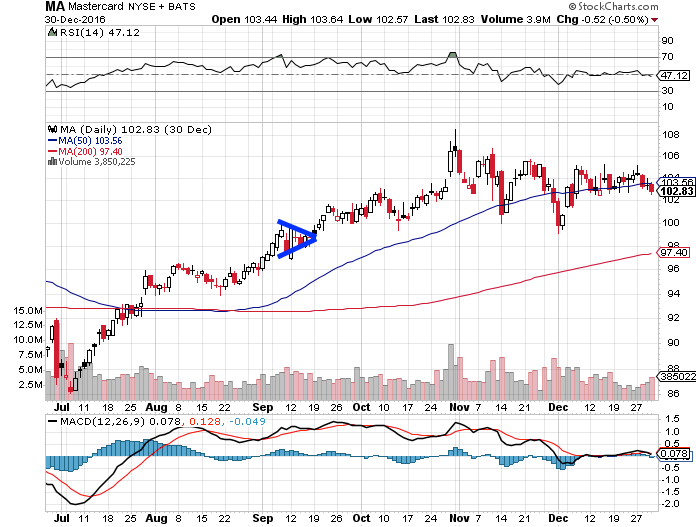
 Once you begin to understand technical analysis, you’re literally looking at a consolidated view of the very forces of supply and demand – the two key forces that drive stocks.


