FREE bonus from this eBook’s sponsor: Live Options Strategy Training Event

Register Now

This eBook is brought to you totally free by the Live Options Strategy Training Events of Dr. Harismran Singh, Ph.D of Dr Singh Options

Register Now
Intro

This eBook is created to provide a collection of strategies, tips and techniques that may assist you in reaching your investing targets.

Investing Target has leveraged its partnerships with educators and investors to provide the information presented in this eBook and we truly hope it is valuable and actionable as you work towards your investing goals.

With the partnerships comes a “Special Offer” or “Free Bonus” in each chapter that we hope you’ll take advantage of in your pursuit for financial success.

Trade & Invest Well,

Investing Target

Chapter
01

Three Options Strategies For Any Market Condition

By Dr. Harismran Singh, Ph.D, Dr Singh Options

Dr. Singh’s Nearly Zero Risk Strategy.

When we expect a stock to go up much higher than it will go down we implement this strategy. We don’t expect the stock to remain flat on the day of expiration of the long call and put.

Here is a recommendation we gave for the stock AXON recently, when it was trading at $14.94.

  1. Buy AXON strike price 12.50 call expiring Aug 18, 2017
  2. Buy AXON strike price 5.0 put expiring Aug 18, 2017
  3. Sell AXON strike price 15.0 call expiring Dec 15, 2017
  4. Sell AXON strike price 12.50 put expiring Dec 15, 2017

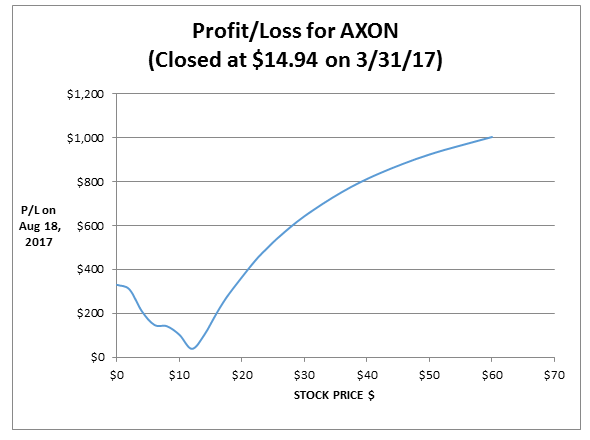
The following graph shows that on August 18, 2017, if the stock drops to $0 we have a profit of $330 and if it goes up to $60, our profit is $1,004. The only time we make a smaller profit is when stock remains flat. Even though the risk is $0, we tell our clients to assume it be about $200 to account for any uncertainties.

The following graph is based on Black Scholes option pricing formula.


Learn the FULL 3-Legged and 4-Legged Options Strategies


Join Dr. Singh, a published authority on wealth creation, for a special, free options strategy session and as a bonus you'll receive a copy of Stock Options – Work 1/2 Hour A Day for free as well. Register here today!


Dr. Singh’s 4-Legged Strategy

We use this strategy when we are almost sure that it will make a big movement on a certain day but not sure of the direction.

The following example will make the strategy clear.

Here is a recommendation we gave for the stock CIEN recently, when it was trading at $25.75.

  1. Buy 3 $26 calls expiring March 17th

  2. Buy 3 $26 puts expiring March 17th

  3. Sell 2 $26 calls expiring March 10th

  4. Sell 2 $26 puts expiring March 10th

Note that the strike price is the same ($26) for all the options but we buy more than we sell.

Here is what we are doing in this trade:

We picked up a stock whose March 17th weekly call and put options can be bought at a relatively lower price than the ones for March 10th which can be sold at a relatively higher price. In this case, we bought the calls and puts which expire on March 17th and sold the calls and puts which expire on March 10. Therefore 3 calls and 3 puts are long and 2 calls and 2 puts are short. We have an extra long call and an extra long put to take advantage of up or down movement of the stock.

If you have a stock which may be coming up with its earnings report or some other major news on a certain date, you enter a day before that event and get out the next day. Who cares if the news is going to be good or bad? You are covered on both sides.

Thus we can take advantage of the movement of the stock in just one day.

Even if we don’t get out in one day, as we come closer to March 10th, the options we sold will lose their premium faster than the options we bought for March 17th. So we may break even if the stock closes flat at $25.75.

If the stock moves up or down, we have an extra call and put option which expire on March 17.

So we end up making money whether the stock goes up or goes down.

Our strategy behind this process is to risk limited money to make unlimited profit.

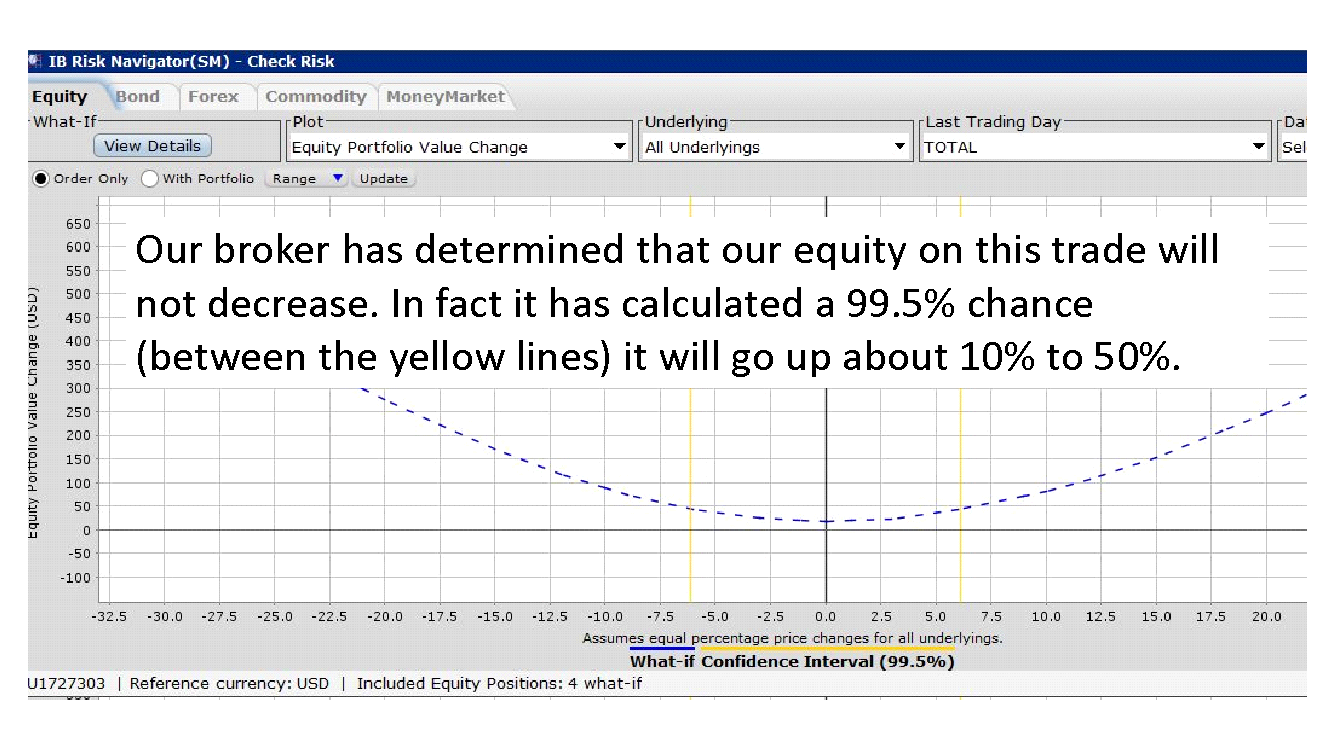
When we put this trade in our brokerage account and check the risk factor, it shows the risk for doing this trade to be zero.

You can see that the brokerage has created a graph of our trade result even if the stock moves dramatically up or down.

But we usually tell our clients the risk to be about $200, not zero as indicated on the graph, to account for any errors and to account for market deviations from historical patterns…

We feel it is worth the risk of about $200 to make $1,000; $2,000; $10,000 or more.

It’s humanly impossible to find such trades without the help of our sophisticated software.

Dr. Singh’s 3-Legged Strategy

In these spreads, we sell a call and sell a put at the same or different strike prices.

In most cases, we may buy a call at a strike price below or above the short call strike price to cover our risk on the upside.

We pick up the options where we can collect enough credit premiums to limit downside risk.

Here is a spread that we recommended to our clients for the stock AXON when the stock was at $11.72.

  1. Sell the $12.50 call expiring September 15

  2. Sell the $5 put expiring September 15

  3. Buy the $10 call expiring August 18

We picked up a long August call to protect us on the upside
as well as to keep our collected credit high. The idea behind this strategy is to reduce the risk and use the collected credits to protect both sides.

The following graph shows that the stock has to drop below $2 on August 18 before you lose money.

The 52 week range of this stock is $10.69 to $17.66. It has never traded below $9.00.

Although anything is possible, it is highly unlikely that this stock will go below $2.00 on August 18. Our approach is extremely conservative and well studied.

The following graph is based on the Black Scholes option pricing model.

Get even more free education on this and more proprietary options strategies directly from me right here.

As a bonus, I’m providing a replay of this lesson and a free copy of Stock Options – Work 1/2 Hour A Day to everyone that registers, so don’t delay - register today!

Dr. Harsimran Singh, Ph.D.

www.DrSinghOptions.com

ABOUT THE AUTHOR

Dr. Singh migrated from India with a total of $8 in his pocket and made tens of millions in various enterprises. He authored 12 books, including “Stock Options – Work ½ Hour A Day” & “We Create Millionaires”. He traded options - over a $100 million in a month. He was awarded a Ph.D. by a California University for his research in options trading strategies. He is a 35-year options trading veteran and a published authority on wealth creation. He holds webinars on his 4 Legged & 3 Legged trading strategies which typically work whether a stock goes up, goes down or remains flat.

Chapter
02

Using Probabilities in Trading for Income

By Don Kaufman, TheoTrade

Welcome to TheoTrade®. Before we dive head-on into Selling Vertical Spreads for Income, it is imperative to set the trade stage with the proper approach and logic of your trading strategies.  The following are key components of TheoTrade’s principles and should be strongly considered prior to entering into a trade or investment.

TheoTrade Principles

1. Trade Logic

2. Capital Allocation

3. Directional Bias

  1. Trade Logic.  At TheoTrade we put your strategy and trade logic first.  The vast majority of people involved in markets are infatuated with market direction, attempting to predict the next move a stock is going to make. In reality, what you “think” a stock is going to do does not always translate into profits.  Many investors and traders alike place far too much emphasis on being right or picking the next move a stock might make.  Our veteran traders dictate the right strategy coupled with established entry and exit criteria. You do not need to be “right” in picking a direction in a stock or the markets in order to be profitable.
  2. Capital Allocation.  How and where you allocate capital should be strongly considered as a viable portion of your trading methodology.  At TheoTrade, capital allocation takes precedence over being “right” in the markets.  Why, you ask?  Experience and watching order flow for decades has taught us invaluable lessons. Have you ever been stopped out of a trade or bailed out of a position only to see the markets turn around shortly thereafter?  How and where you allocate capital can define not only losses but it can be the defining factor in your overall success or failure in the markets.  Our war cry is “duration over direction”, you need to be capable of sustaining trades long enough to be profitable.
  3. Directional Bias.  We are not anti-charts.  Rather we recognize where you “think” a stock might go does not always mean the markets will agree with your sentiments.  Being right directionally cannot define us as investors or traders for we may not be “right” often enough.  At TheoTrade we are realists of the marketplace and we must place our capital at risk ONLY with the correct trade logic and a comfortable allocation.

Short Vertical Spreads

The most important and sound method of looking at a vertical spread is from the viewpoint of probabilities.  All trading strategies and logic need to account for all possible outcomes.  Examining outcomes will help a trader determine a price at which a vertical spread must be sold in order to make a profit.  However, a diligent trader must also recognize and offset losing trades,, for winning trades alone DOES NOT make traders profitable in the long run. A winning streak one receives when selling vertical spreads means little or nothing and without adequate principles will be short lived.

Theory Behind Vertical Spreads

Probabilities are a fact of life. The second we are born the nurses weigh us, measure our length and assign an Apgar score to group us into certain categorical components that allow the doctor to make statistical assumptions about our physical health. Car insurance, mortality rates, point spreads in sporting events all use probabilities to make an educated guess/approximation of what to expect under certain circumstances.  Insurance companies make and lose great deals of money based on when you die compared to the mean (average) age of death for a male or female. Vertical call and put spreads are no different.

Assume that we sell an October 60-55 put vertical spread at $1.50 in stock ABC trading at $60 per share. Will we make money?  Your initial thought is to ask, “is the stock in a bull or bear trend?”  In trading we must account for all outcomes; therefore, the trend will end 50% of the time once you identify it to be a trend and act on it.  In the TheoTrade aforementioned principles, please recall, “Being right directionally cannot define us as investors or traders for we may not be right often enough.”

A more simple question would be to first ask, “What is the likelihood that the stock is going to be above (our winning area) or below (our losing area) $60 at some point in the future?” We all know, even if we don't believe it, that the answer is 50% of the time the stock will be above $60. That means that roughly 50% of the time the stock will be below $60, resulting in us giving back some, if not all or more, of the premiums received when we sold the spread. 

Now, with this said, what is the amount that we should receive for the sale of the call spread to be a fairly priced trade? Our first instinct may be to say, “Since the vertical spread we are looking to sell is a $5 spread; and since we can lose $5 on a $5 spread; and since the stock will go down about 50% of the time; thus, we must get at least 50% of the $5 (or $2.50) for the spread to be fairly priced”.  CLOSE – BUT NO CIGAR!

One must remember what the statement “50% of the time the stock will be above $60” means. Certainly it has been displayed that half the time an underlying will rise, and the other half of the time it will fall. This, however, does not say ANYTHING about the extent to which it can move. Or stated another way, if the stock is below $60, thus resulting in a potential loss on the sale of the vertical put spread, it could be $0.10 below $60 (at $59.90) or $20 below $60 (at $40). At either price the statement is true.

Many factors play a crucial role in predicting what we can expect a stock’s movement is likely to be. Seasonality, time until expiration (the more time – the more the stock is likely to move), geopolitical events, the economy, and volatility (as well as many other factors) all have an integral impact on how much ABC is likely to move beyond what direction it is going to move.

Should the stock ABC move against us, but by a small amount of say $0.10, the vertical spread would be a winner provided we sold it for anything more than $0.10, even though the stock went in the wrong direction. Had we received $5 for the sale of the vertical spread when we sold it, there is no way we can lose money. The worst that could happen is the stock moves against us in a large dollar move to the point where the spread is worth $5 at expiration, and we therefore have to give back all we have originally collected.

As this exaggerated example shows us, the amount we receive is very important in predicting our success on the trade. The more we sell a spread for, the more of a “buffer” we have against loss.

Another way of looking at this is from the reverse perspective of what we are doing (selling the spread) from the perspective of the buyer.  Let us evaluate two different spreads using TheoTrade logic to see which the better candidate for purchase is. Movement will likely be the determining factor. Take a look at the two spreads below.

All other variables being equal, it is evident that the purchase of the ABC spread is the better of the two. If for no other reason than the individual who purchases the XYZ spread can’t have any reasonable expectation (based on the past) of ever making money on a long put spread with the long put (the put purchased) being at the 60-strike. Based on the stock’s history from last month, in which it had a $2 range with a low of $59, the long put spread is unlikely to make any significant amount of money.  Should the stock sell off to reach last month’s lows ($59), the 60-55 put vertical spread (long the 60 put—short the 55 put) will have $1 of intrinsic value at expiration. Since the spread sale resulted in a credit of $1.50 to initiate, the net result will be a $0.50 per share loss ($1.50 credit from sale - $1.00 intrinsic value given back as the 60-put sold is $1 ITM = $0.50 loss). 

Even if the stock moves the full amount of last month’s range of $2 ($61 high - $59 low) to the downside, that would put the stock at $58. With the stock at $58 on expiration, the 60-55 put spread would only be worth $2 intrinsically, thus resulting in a profit of $0.50, or +33%. Now a 33% return is not horrific compared to expected annualized returns of 8% when owning a diversified portfolio; however, it is far inferior to the vertical spread in ABC.

Do not get confused with this example. It may seem logical to think that since ABC can move so far up, given last month’s performance of a high of $80, that a put spread would certainly be a loss in that direction, especially seeing that stock XYZ reasonably can only get up to $61 should the stock run up, that the ABC spread may be better. This is not true, in that the XYZ spread at its full range of profitability in our favor (down) reasonably could only expect a profit of $0.50 when the stock closed at a new low of $58. 

Yet, the ABC spread needs to only see the stock get as low as $55 per share for us to make the maximum on the spread. Since last month the stock got as low as $39 a share, it is not at all difficult to assume that the stock can get down to a place where we will make the maximum on the spread, that being $55.

In an additional example, assume there are only two possible prices for each stock at expiration, that of its high or its low. Which spread would you rather own IF IT WERE FREE, knowing that each stock can only close at either its high or low for last month?  The math below should answer that for you in a way that is likely more obvious than it was minutes earlier.

Looking above it becomes clearer which of the spreads is the preferable one to own, especially if it were free.  As only two possible scenarios at expiration make it easier to understand, we will look at them both.

Stock Goes Up

Using the example of the stock moving up first, we see that both spreads are equivalent. It doesn’t matter if the stock closes at $61, $80 or $300, the put spread is still going to go out worthless, resulting in a complete loss of the investment.  Thus, both spreads are equivalent should the stock increase in value between the time it was initiated and that of expiration.

Stock Goes Down

Should the stock decline in price to the only possible downward closing price, it becomes clear which of the two is the preferable spread to own, whether it is free or costs us the $1.50. Stock ABC will be worth the maximum it can be worth on the downside, whereas, stock XYZ will still result in a loss. XYZ’s loss is a result of the stock going down, but not down enough to offset the cost of premiums invested at the time of purchase.

Overview of Comparison

As is evident from above, it doesn’t matter what the stock does as each spread, in the worst scenario, is equivalent in loss. On the other hand, if you were correct in the predication market direction (down) for each stock, the former (ABC) will result in a profit whereas the other (XYZ) will result in a loss. The determining factor in how much to pay when buying a spread, or how much you will want to receive when selling the spread, is based primarily on how volatile the stock is. The more the stock is capable of moving in either direction will determine, to a large extent, what the spread is worth. The more the stock can move, the higher the price of the spread. It is the same thing as if you own earthquake insurance. The higher the likelihood of your house moving (California San Andreas Fault vs. Hartford, Connecticut), the more your insurance is likely to cost.

Summary

What it all comes down to is probabilities. Since a stock that can move more has a greater chance of moving in the direction we want, we are willing to pay more for it than for a stock that isn’t moving enough to likely make us a profit. So what is the mathematical probability of ABC or XYZ closing at $55 or lower so that we can make the maximum on the spread? Or, what is the likelihood that the stocks can get down to $58.50, a place where we break even on the trade? We have no idea (yet), but whatever that number is, it will likely tell us how much the spread is worth.

Simplified Example of Probability With Balls

Suppose you were involved in an office lottery pool but only four people were playing, and someone has to win the $100 prize. Every contestant pulls a ball out of a bucket containing three black balls and one white ball. Whoever gets the white ball gets the $100 prize, and the three contestants who got black balls lose their wager. What is the most you would pay to get into this office pool?  Would you pay $10?  $20?  $40?

Obviously the correct answer to the question is anything up to $25. As there are only four possible winners, someone has to win, and each has an equal chance of pulling the white ball out of the bucket, each ball has a theoretical value of $25. Or, if you were the only player and bought all four balls chances for $25 each, you would be assured of getting your money back.

If the ball game is organized  and selling each chance at $20 per ball, you could go out and buy all four balls for $80 ($20 a ball X 4 balls = $80), and be assured the $100 prize, thus netting a $20 profit without risk.

Simplified Example of Probability with Vertical Spreads

Let’s expand this example to include making some real money by trading vertical spreads. We saw earlier that the XYZ 60-55 put spread could at best be worth $1.00 at expiration, but cost $1.50 initiate. Thus, the absolute best that we could expect is to lose $0.50, and could just as likely lose $1.50. So, does paying $1.50 for the XYZ spread make reasonable sense? Obviously not. But what constitutes a bad purchase almost always constitutes a good sale.

If buying the spread can at best result in a loss of $0.50, then the individual who sold the spread will likely make at least $0.50 every time he/she sells this spread under these conditions. And if the stock stays in the same spot, or goes higher, he/she will make the full $1.50 he sold the spread for!

This, albeit an extreme example, is the thought pattern we will undertake to initiate the sale of a short spread. As stated earlier, the mathematical concepts behind pricing out a short vertical spread are far more complicated (as the stock has a wide variety of possible closing prices) than the bucket of four balls example.  TheoTrade has developed detailed entry and exit criteria (a recipe) for selling vertical spreads using probability and outcomes to determine expected returns.

THE SPECIAL OFFER

TotalTheo®

Learn how the markets really work from veteran traders with 15+ years experience trading for income. TotalTheo is a unique, all inclusive trading subscription for stock, options, and futures traders. Included with TotalTheo:

  •  TheoNight® Video Newsletter - Dissect the Anatomy of the Markets Each Night ($50 Value);
  •  TheoChat® - Real Trade Ideas and Real-Time Market Insights ($150 Value);
  • TheoClass® - Monthly Class on a Host of Topics Ranging from Stocks, Options and Futures ($100 Value);
  • TheoCoach® - Daily Coaching Sessions with Timely Topics on Verticals, Volatility, Scalping, and more ($50 Value);

TheoEvening® - Weekly Evening Coaching Session on Swing Trading, Portfolio Management, Hedging, and More ($50 Value);

TheoArchive® - Missed something we said? Find it all in Your Membership Portal, and Instantly Replay and View Every Second ($100 Value).

Other firms will charge at least $500/month to get everything TotalTheo® includes. At TheoTrade® the regular rate is $150/month. As a thank you for reading this chapter you can lock in 33% off the regular rate for life by clicking the image below:

ABOUT THE AUTHOR

Don Kaufman is one of the industry’s leading financial strategists and educational authorities. With 18 years of financial industry experience, Mr. Kaufman oversees TheoTrade’s firm-wide strategy and deployment initiatives, while designing and executing upon innovative content in the financial education space.

Prior to TheoTrade, Mr. Kaufman spent six years at TD Ameritrade® as Director of the Trader Group. At TD Ameritrade Mr. Kaufman handled thinkorswim® content and client education which included the design, build, and execution of what has become the industry standard in financial education. He started his career at thinkorswim® in 2000 (acquired by TD Ameritrade® in 2009), where he served as chief derivatives instructor, helping the firm progress into the industry leader in retail options trading and investor education services.

Specialties: Equities, Options, Futures, Currencies, Risk Management, Financial Modeling, Technical Analysis, Volatility and Derivative Pricing, Market Making.
Chapter
03

Important Trading Tips for Options Buyers

By Roger Scott, Market Geeks

Buying options is different than buying the underlying asset, because not only do you have to be right on the underlying market direction, but you also must consider other factors, such as time decay, volatility levels and several other factors that can cause you to be 100% accurate on direction of the underlying asset, and still end up losing the entire premium paid.

When it comes to buying options, there are several pitfalls that can be avoided by following some simple trading tips that I’ve outlined below. While there are no guarantees when it comes to buying options, I can promise you that each these trading tips are based on over 20 years of actual trading, running two hedge funds and mentoring thousands of traders over the years.

Get Swing Trading Profits E-Book At NO COST Today!

Step By Step Approach That Will Help You Achieve Long Term Swing Trading Success

Get the eBook for free by clicking here!

Trade in The Direction of The Major Trend

It’s very tempting as well as less difficult psychologically to trade against the trend. People are naturally conditioned to buy low and sell high, so it’s very difficult for some to change their belief system when it comes to financial markets.

I’ve back tested numerous trading methods over the past two decades and trading in the direction of the overall trend lowers your risk, increases size of gains and percentage of profitability.

To determine whether or not the underlying asset is trading in an uptrend, simply confirm that the underlying asset is trading above both the 90 day and 50 day simple moving average.

To confirm that the underlying asset is trading in a strong downtrend, the underlying asset must trade below both the 90 day as well as the 50 day simple moving average.

Don’t Use Stops and Market Orders

The only type of order you want to utilize when buying options is a limit order. Market orders will cause you incur unnecessary slippage, because the spread between the bid and offer can be rather wide with the majority of options contracts.

Stop orders can be equally as bad because once the stop gets executed, the order becomes a market order, which opens you up to terrible slippage over time.

Often times I see traders using stop limit orders; this type of order becomes a limit order after the stop is triggered, so there’s no guarantee that you will get filled on the trade.

If you do decide to experiment with stop limit orders, avoid using them for risk protection, since you may or may not be filled; something you don’t want to chance when it comes to risk control.

Avoid Information Overload

One of the most important characteristics of successful trading is having confidence in your strategy in good times and in bad times. Recently, I spoke with a trader who followed twelve different advisory services. While the trader was knowledgeable, he sounded confused and never knew with certainty if he should be buying or selling.

While I encourage everyone to learn as much as possible about options trading, following more than one or two advisory services will only confuse you and undermine your confidence in your own belief system; which is crucial to your long term-trading success.

Use Time Stops Instead of Stop Loss Orders

One of the main differences between the underlying asset and the option is time value. With stocks, ETF’s and bonds, time is not a factor; in other words, the length of time you hold the position has no impact on the price of that position.

Since options are derivatives, they are subject to time decay, which is beneficial for the seller of the option and detrimental for the buyer, since each day the option loses value due to time decay.

Not realistically taking into account the length of time you intend to stay in the position is equivalent to trading the underlying asset and not using stop loss orders to protect against unforeseeable risk of loss.

With options, I always make sure to give each trade a maximum holding time period. Unless you do so, you will find that you end up holding the position till expiration or till it makes no sense to liquidate it. Setting guidelines for how long you intend to hold the long options position will force you to cut your losers quicker.

Monitor VIX Level Daily

If you trade stocks, ETF’s or index options, you need to know and follow the VIX index very closely. The VIX is a key measure of market expectations of near-term volatility conveyed by S&P 500 stock index option prices.

Most stocks and ETF’s have a high correlation to the overall market, so in addition to comparing the implied volatility level of each stock or ETF that you trade, you should also examine the volatility of the overall market, since it will have a major impact on the price of the option that you are trading.

Know the Option’s Delta Ahead of Time

The option’s delta is the rate of change of the price of the option with respect to its underlying assets price. If a call option has a delta of $0.25, the option will move about $.25 given a $1 move, up or down, in the underlying.

The Delta can range from 0 to 1.00 for calls and 0 and -1.00 for puts and tends to be increase as the options strike price gets closer to being in the money and moves further away as the option gets further out of the money.

Buying options with low Delta will cause the options sensitivity to be extremely low in comparison to the movement in the underlying asset.

Therefore, I recommend you purchase options that have a minimum Delta of .50 for call options and -.50 for put options. This way you will assured that the option that you purchased will gain at least $.50 for every $1.00 move in the underlying asset.

Implied Volatility Levels Must Be Low

Implied volatility represents the expected volatility of the underlying asset. Implied volatility is directly influenced by the market’s expectation of the underlying assets degree of movement as well as direction. Options that have high levels of implied volatility will result in expensive option premiums.

Conversely, as demand for an option diminishes, implied volatility will decrease. Options containing lower levels of implied volatility will result in cheaper option prices, which makes them ideal for buyers. Options that are trading further from the strike price and are out of the money, tend to be influenced by implied volatility more than options that have high intrinsic value, because implied volatility only influences the time value component of the option.

Always check the implied volatility level on the underlying asset before purchasing options, because if implied volatility levels on the underlying asset are high, the odds are strong that the options will be expensive and if implied volatility on the underlying asset is low, you will find that the options are priced lower.

Most options brokers offer software that will help you track the underlying assets implied volatility level. I recommend you only buy options when the implied volatility level is in the lower 30th percentile of the annual range and avoid buying options when implied volatility moves relatively higher.

In conclusion, by following these simple trading tips, you will avoid common mistakes that can make a big difference in your options trading.

THE SPECIAL OFFER

ABOUT THE AUTHOR

Roger is a professional trader and a successful entrepreneur with over 20 years of experience in the financial industry. He began his journey in the early 1990s as a short-term stock trader.

Shortly after completing law school and spending many years simultaneously studying advanced technical analysis, risk control, money management and systematic trading, Roger became a successful futures broker and a hedge fund manager with experience trading stocks, index futures, commodities, options and foreign currency markets.

In early 2005, Roger co-founded a trading education firm focused on short-term and day trading strategies. He helped develop programs that took complex trading ideas and concepts and communicated them with simple explanations and relevant examples.

Chapter
04

6 Key Market Based Inputs

By Mark Soberman, Netpicks

Day trading indicators are often touted as the holy grail of trading, but that is simply not true.

They are a useful trading tool that should be used in conjunction with a well-rounded trading plan but are not the plan itself.

Please note, as a reader of my chapter, you’re entitled to my full report: 8 Strategies for Trading with Indicators & Price Action to Create a Lifetime of Investing Income.

In this article I will cover:

  • The uses of trading indicators

  • Indicator selection

  • Two simple trading methods you can expand on

KEEPING TRADING SIMPLE

Whether you swing trade, day trade, or even position trade, too many trading indicators equals complexity which usually equals lack of consistency with trading decisions.

Information overload is often the result of traders finding a mix of day trading indicators potentially useful but in fact don’t really help in the trader making a profitable decision.

I have used trading tools in different combinations over the years, and there are three that I found to initially be the most useful day trading indicators for how I like to trade.

As time went on, simple became my mantra, and as a result, my trading decisions were clearer and were made with much less confusion and stress.

Grab the Income Indicators eBook

Learn 8 unique and powerful ways to trade with indicators and price action to help you generate an income for life.

We’ll show you the exact system and setups we use to generate high-probability opportunities.

Grab it Here

DAY TRADING INDICATORS GIVE INFORMATION ABOUT PRICE AND VOLUME

Almost every charting platform comes with a host of indicators that those who engage in technical trading may find useful. You simply apply any of them to your chart, and a mathematical calculation takes place taking into past price, current price and depending on the market, volume.

DIFFERENT TYPES OF TECHNICAL INDICATORS DO DIFFERENT THINGS:

  • Trend direction

  • Momentum or the lack of momentum in the market

  • Volatility for profit potential

  • Volume measures to see how popular the market is

The issue now becomes using the same types of indicators on the chart which basically gives you the same information. While this may be explained as looking for “trade confirmation“, what it really does is give you conflicting information as well as more information to process.

A simple example is having several trend indicators that show you the short term, medium term, and longer term trend. From a multiple time frame perspective, this may appear logical.

Many traders though can attest to seeing a perfectly valid setup negated because of a trend conflict and then watching the trade play itself out to profit.

Too much information can cause analysis paralysis which can keep you from making trading choices that are actually profitable ones.

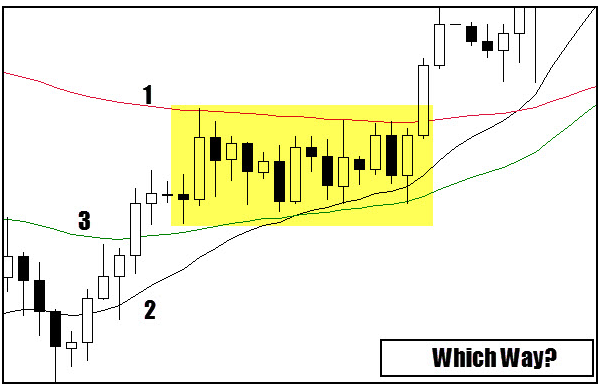
breakout trading

Looking at just the trading range portion and price relation to the moving average, we have:

  1. Price below longer term average means short

  2. Price above medium term means long

  3. Price above short term means long

Not seen on this chart but the pivot black candle below #2 is actually a retrace into an area where a long trade was the call yet all trading indicators called to short at that time.

That is the main drawback with most trading indicators, and that is since they are derived from price, they lag price.

A trend indicator can be a useful addition to your day trading but be extremely careful of confusing a relatively simple trend concept.

Day Trading Question: Day trading involves quick decisions.

Would your trading be better served by simple or complex information gathering?

USEFUL TRADING INDICATOR SELECTION

Useful is subjective, but there are general guidelines you can use when seeking out useful indicators for your day trading.

One simple guideline is to choose one trend indicator such as a moving average and one momentum trading indicator such as the stochastic oscillator.

In order to explain how these can be useful as day trading indicators, take a look at this chart:

momentum and trend trading indicators
  1. In brief, this is a pivot area where price broke through and rallied hard away from the moving average

  2. Price starts to trade above moving average as well as slope of indicator is up and our plan says trend is up

  3. Price returns to the area marked #1 (also a complex ab=cd retrace)

  4. Momentum indicator crosses and turns up and we buy stop the high of the candle that turned it

Simple selection of trading indicators mixed with chart technicals can be the basis for your trading system.

DO TRADING INDICATORS WORK?

It all depends on how they are put together in the context of a trading plan. Some of the most used technical indicators such as moving averages, MACD, and CCI work in the sense that they do their job in calculating information.

THE POWER OF THE INDICATOR LIES IN HOW YOU INTERPRET THE INFORMATION AS PART OF AN OVERALL TRADE PLAN.

Don’t be sold on the “holy grail” indicator that marketers flood your inbox with. Proper usage of basic indicators against a well-tested trade plan through back testing, forward testing, and through demo trading is a solid route to take.

All of the systems that are offered by Netpicks not only come with tested trade plans but also hammer home that you must prove any trading system or trading indicator to yourself.

THREAT OF OVER-OPTIMIZATION

There is a downside when searching for day trading indicators that work for your style of trading and your plan.

Many systems that are sold use standard indicators that have been fine tuned to give the best results on past data. They package it up and then sell it without taking into account changes in market behavior.

The backbone of many trading systems are very mechanical in the sense that “if A happens, do B”.

There is nothing wrong with optimizing to take into account current market realities but your approach and mindset in doing so can either have you being realistic or over-optimizing out of the realm of reality.

One way you may choose to not fall into the over-optimizing trap is to simply use the standard settings for all trading indicators. This ensures you are not zeroing in on the most effective setting for the market of today without regard for tomorrow.

SMALL LIST OF USEFUL DAY TRADING INDICATORS

As I mentioned at the start of this article, there are three indicators which I personally have had great success with over the years and is how I started.

My trading as evolved as I began to understand other aspects of the trading but these are where I started:

  1. Fibonacci

  2. Moving averages

  3. CCI – Commodity Channel Index

For the sake of consistency, I am going to use the same chart as I previously did. This is a day trading/swing trading chart of 1 hour on a Forex pair.

fibonacci moving average cci
  1. This zone was determined once the swing high was in place. It is a combination of the Fibonacci retracement and Fibonacci expansion (used for symmetry)

  2. This is the moving average used for objective trend determination. A short term setting will give you faster trend changes with more whipsaw. A longer term setting can have you miss a large portion of the current move

  3. Once the CCI comes close to or crosses the 0 level, a buy stop is placed above the high.

You can see the trend is up and price has retraced into an area that I would be interested in taking a trade. Once price hits the area, there is a potential setup but a trade trigger is needed to get into the trade.

The commodity channel index plus price moving in the trade direction is the needed trigger.

I purposely left out exact rules and settings (hint – settings are standard) so you can design your own strategy using your current trading knowledge.

This exact setup is applicable to day trading, swing trading, and even position trading

To summarize:

  • Moving average – Determine trend and can be part of the process in triggering in a trade and momentum plays. (both not described in this trading article)

  • Fibonacci – Determine, in advance of price, zones I may be interested in for a setup and possible trigger. Can also be used for profit targets.

  • CCI – Used for trade triggers but does have many uses including trend determination.

DOES THE CHOICE OF TRADING INDICATORS CHANGE?

As you can see, this list gives the 3 most useful trading indicators for me at a certain point in my trading.

Times change and what was useful then may not be useful for me today.

Every trader will find something that speaks to them which will allow them to find a particular technical trading indicator useful. Whatever you find, the keys is to be consistent with it and try not to overload your charts and yourself with information.

Simple is usually best:

Determine trend – Determine setup – Determine trigger -Manage risk

Get a free bonus report just for reading my chapter:

ABOUT THE AUTHOR

Mark Soberman founded NetPicks in 1996. Mark started trading actively back in the 1980s while attending UCLA. His first trade was Johnson and Johnson calls. Without success, he went onto trading more stocks, options and then futures. After another unsuccessful futures trade, he started his search for the right combination of indicators, training and trade plans. That ultimately led to the founding of NetPicks.com which for 21 years has been dedicated to the education, training, and empowerment of active individual traders. Using Futures, Forex, Stocks & Options to fit each student best the mission has been to help people like yourself succeed in supplementing or replacing income through active trading.