One of the best ways to become a great trader is to try new things.
Unfortunately, there’s no such thing as a perfect strategy. But if you’re willing to trade outside of the box, you can become a better trader.
Over the last 20 years, I’ve combined hundreds of different technical strategies.
At the moment, I’ve settled on the use of Bollinger Bands (2,20), MACD, relative strength (RSI), Money Flow (MFI), and Williams’ %R. I find that when all agree with one another in overbought or oversold conditions, it can lead to up to 85% trading success.
However, it’s not a perfect strategy, as much as I wish it were.
And while I’ll continue to tweak it, and attempt to make it better, the one component I’ll never leave out is Williams’ %R (W%R). That’s because – to me – it’s the perfect indicator. Oftentimes, I’ll find that it begins to turn higher or lower before a stock, index or ETF does.
The Inflation Report – Free eBook
The markets are in a time of chaos, we’re seeing numbers we have not seen in 40 years, and panic has ensued… That is why our team has prepared this inflation report, using fundamental concepts used successfully for decades.
Williams’ %R (W%R)
Typically, when Williams moves to or above its -80, it’s an indication the asset is oversold. When it moves to or above the -20-line, it’s overbought.
And while that’s a simplistic explanation, it’s powerful when caught.
Look at Facebook (NASDAQ:FB) for example. Granted, in August 2018 it was a technical disaster.
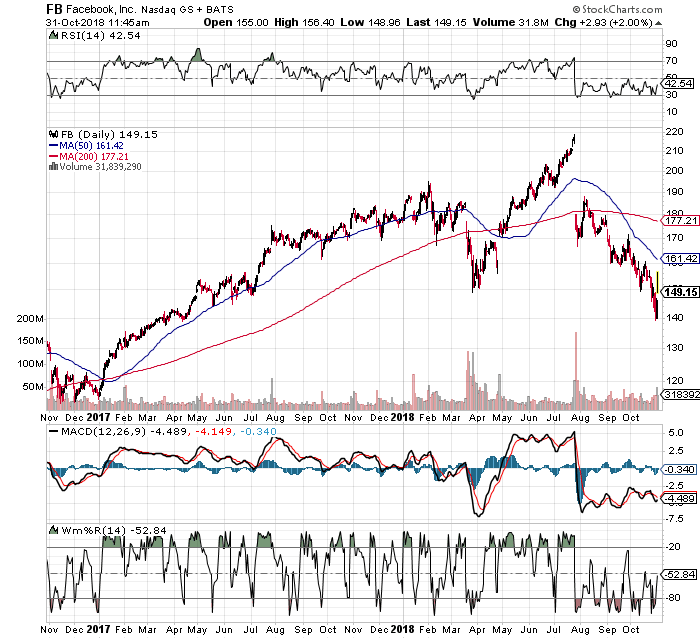
But look at what happens when W%R falls into oversold territory, or jumps into overbought territory. Over the last two years, any time W%R moved to or above its 20 line, the stock began to reverse. And, each time W%R fell to or below its 80-line, the stock would reverse.
This happened up to 85% of the time.
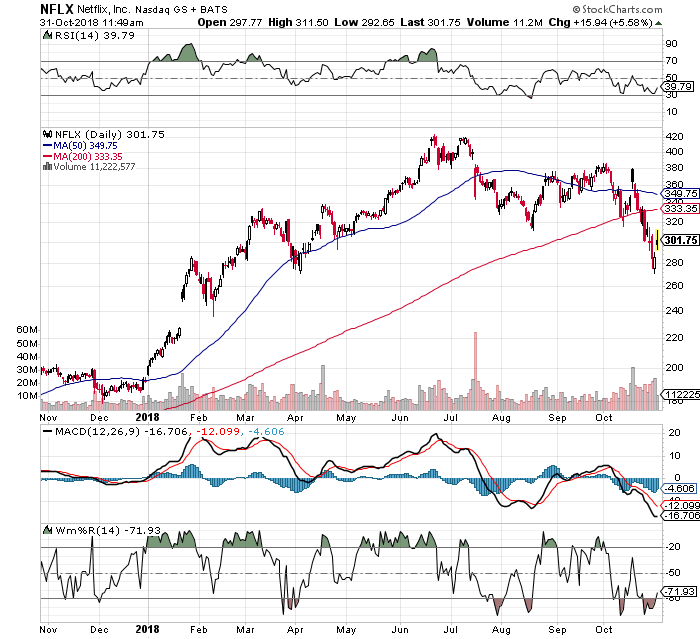
We can see it with Netflix (NASDAQ:NFLX), as well. Nearly 85% of the time when Williams’ %R moved above its 20-line, or dropped below its 20-line, the stock has pivoted.
Confirm with Other Key Indicators
Of course, it’s never wise to just use a single technical indicator. Always be sure to confirm. For example, until I update my system again, I’ll confirm with the following:
- When RSI moves to or above the 80-line, we have an overbought condition. When RSI moves to or below the 20-line, we have an oversold condition. It confirmed what Williams was telling us.
- With MACD we’re simply looking for unsustainable, big moves.
- With Bollinger Bands (2,20), when a stock – or index – touches or penetrates the lower band, the situation can be considered oversold. When a stock touches or penetrates the upper band, it can be considered overbought.
At the moment, these are some of my personal favorites.
However, to become better I need to be willing to try new things, as well.