Candlestick patterns may have some odd names.
Abandoned baby bottom, three black crows, dark cloud cover, for example. But these are some of the most powerful tools you can add to your strategy, including these three.
Candlestick Pattern No. 1 – The Doji Cross
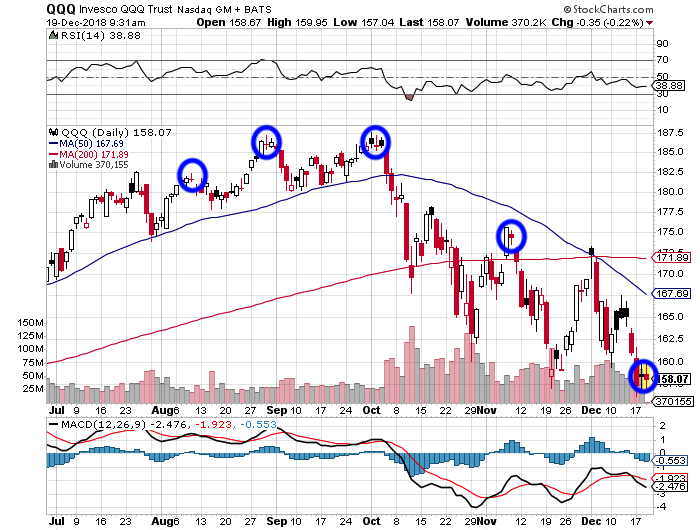
Doji crosses are a sign of indecision of bulls and bears. And when found at the top or bottom of trend, it can indicate that a reversal may be nearing. However, as with any technical indicator, confirmation is key. For example, it’s best to confirm with other indicators such as over-extensions on Bollinger Bands (2,20), MACD, relative strength (RSI) and Williams’ %R.
However, as you can see such crosses on a chart provide consistent data for potential reversals.
For example, as you can see in this chart of the QQQs, a doji cross marked top of trend at least four times since August 2018.
The Most Efficient Way to Find Options Trades
Those who trade options on a whim, with no rules and no plan, will become food for Wall Street, often blowing out their accounts within months. On the other hand, successful traders spend months, and sometimes years, mastering a few strategies before risking a dime in the markets.
Candlestick Pattern No. 2- The Hanging Man
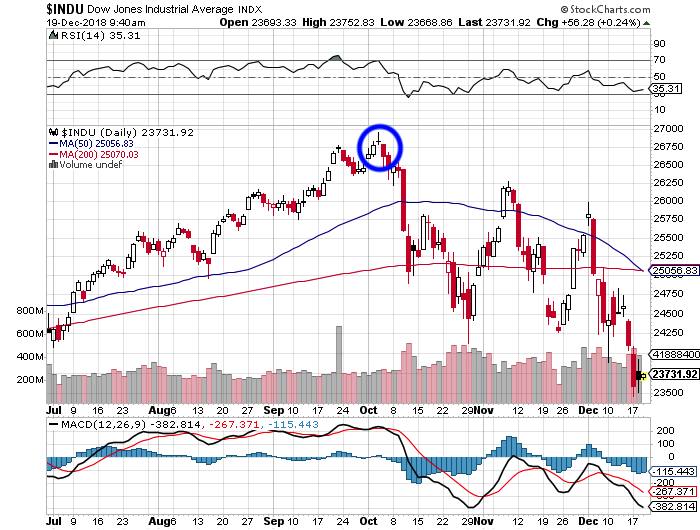
The Hanging Man is a bearish candle that can form at top of trend. It’s typically created when we find a significant sell-off near the market open at top of trend. As the day progresses, buyers begin to force the stock higher to its initial opening prices.
When we see this candlestick, it can be an indication that the bulls are just beginning to lose control and demand for the stock or other asset is starting to fall apart. Since the pattern is observed after a push higher, it signals that selling pressure is starting to increase.
For example, we can see one following a doji cross at top of trend in early October 2018. Following its appearance, the Dow Jones fell from 26,750 to 25,056.
Candlestick Pattern No. 3 – Three White Soldiers
This is one of the oddest named candlesticks, but it can be one of the most powerful.
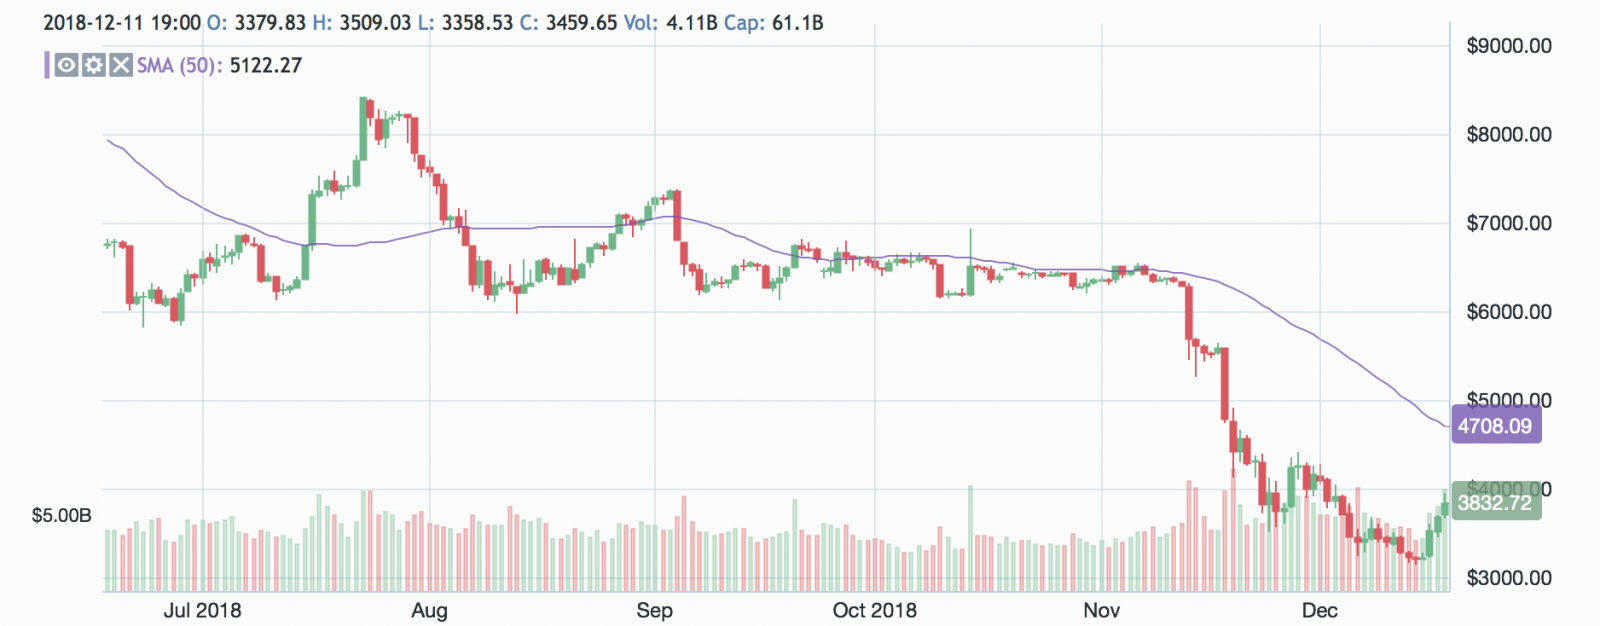
We can clearly see them at the tail end of this six-month chart of Bitcoin (BTC). This pattern is typically seen as a bullish candlestick pattern after a strong pullback. If it can maintain this pattern, Bitcoin could stage another big rally following its decline.
Typically, the three white soldiers consist of three large bullish candles, each closing higher than the last one. Each candle opens within the body of the one preceding it.
Again, though, never rely on just one indicator – such as a candlestick. Always be sure to confirm your findings with other indicators, such as Bollinger Bands, MACD, relative strength (RSI) and Williams’ %R.
We use cookies on our website to give you the most relevant experience by remembering your preferences and repeat visits. By clicking “Accept”, you consent to the use of ALL the cookies.
This website uses cookies to improve your experience while you navigate through the website. Out of these, the cookies that are categorized as necessary are stored on your browser as they are essential for the working of basic functionalities of the website. We also use third-party cookies that help us analyze and understand how you use this website. These cookies will be stored in your browser only with your consent. You also have the option to opt-out of these cookies. But opting out of some of these cookies may affect your browsing experience.
Necessary cookies are absolutely essential for the website to function properly. These cookies ensure basic functionalities and security features of the website, anonymously.
Cookie
Duration
Description
cookielawinfo-checkbox-analytics
11 months
This cookie is set by GDPR Cookie Consent plugin. The cookie is used to store the user consent for the cookies in the category "Analytics".
cookielawinfo-checkbox-functional
11 months
The cookie is set by GDPR cookie consent to record the user consent for the cookies in the category "Functional".
cookielawinfo-checkbox-necessary
11 months
This cookie is set by GDPR Cookie Consent plugin. The cookies is used to store the user consent for the cookies in the category "Necessary".
cookielawinfo-checkbox-others
11 months
This cookie is set by GDPR Cookie Consent plugin. The cookie is used to store the user consent for the cookies in the category "Other.
cookielawinfo-checkbox-performance
11 months
This cookie is set by GDPR Cookie Consent plugin. The cookie is used to store the user consent for the cookies in the category "Performance".
viewed_cookie_policy
11 months
The cookie is set by the GDPR Cookie Consent plugin and is used to store whether or not user has consented to the use of cookies. It does not store any personal data.
Functional cookies help to perform certain functionalities like sharing the content of the website on social media platforms, collect feedbacks, and other third-party features.
Performance cookies are used to understand and analyze the key performance indexes of the website which helps in delivering a better user experience for the visitors.
Analytical cookies are used to understand how visitors interact with the website. These cookies help provide information on metrics the number of visitors, bounce rate, traffic source, etc.
Advertisement cookies are used to provide visitors with relevant ads and marketing campaigns. These cookies track visitors across websites and collect information to provide customized ads.